Caching and Buffering

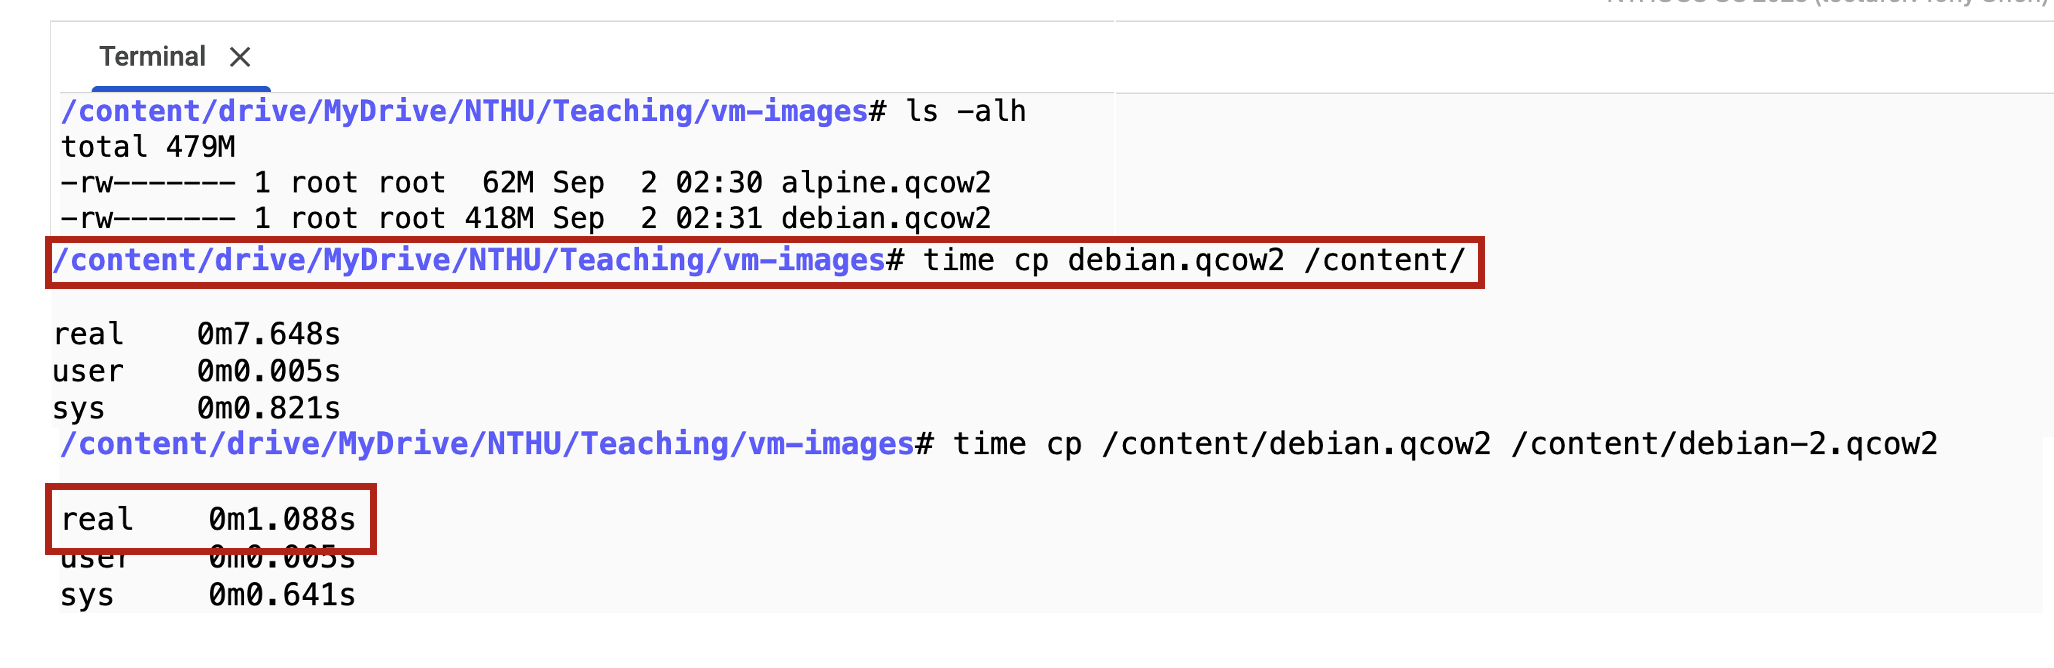
Think about how you get sushi for dinner. You first check your refrigerator (SRAM). If your fridge is empty, you call Uber Eat to get from 爭鮮 (Sushi Express) (DRAM). 爭鮮 might buy a large amount of salmon from Costco (SSD). Costco might get their salmon from Norway (very far away … Google Drive!?), which takes a very long time.
Each step in this chain is a cache. Your refrigerator is a cache for 爭鮮, 爭鮮 is a cache for Costco, Costco is a cache for Norway.
Your computer’s memory hierarchy is also the same. When your CPU needs data, it first checks its “refrigerator,” the SRAM. If the data isn’t there (a cache miss), it checks DRAM. If the data isn’t in RAM either, the OS must fetch it from the SSD.
Source: Latency numbers every programmer should know
L1 cache reference ......................... 0.5 ns
Main memory reference ...................... 100 ns
SSD random read ........................ 150,000 ns  = 150 µs
Send packet CA->Netherlands->CA .... 150,000,000 ns  = 150 ms
L1 cache reference 0.5 s One heart beat (0.5 s)
Main memory reference 100 s Brushing your teeth
SSD random read 1.7 days A normal weekend
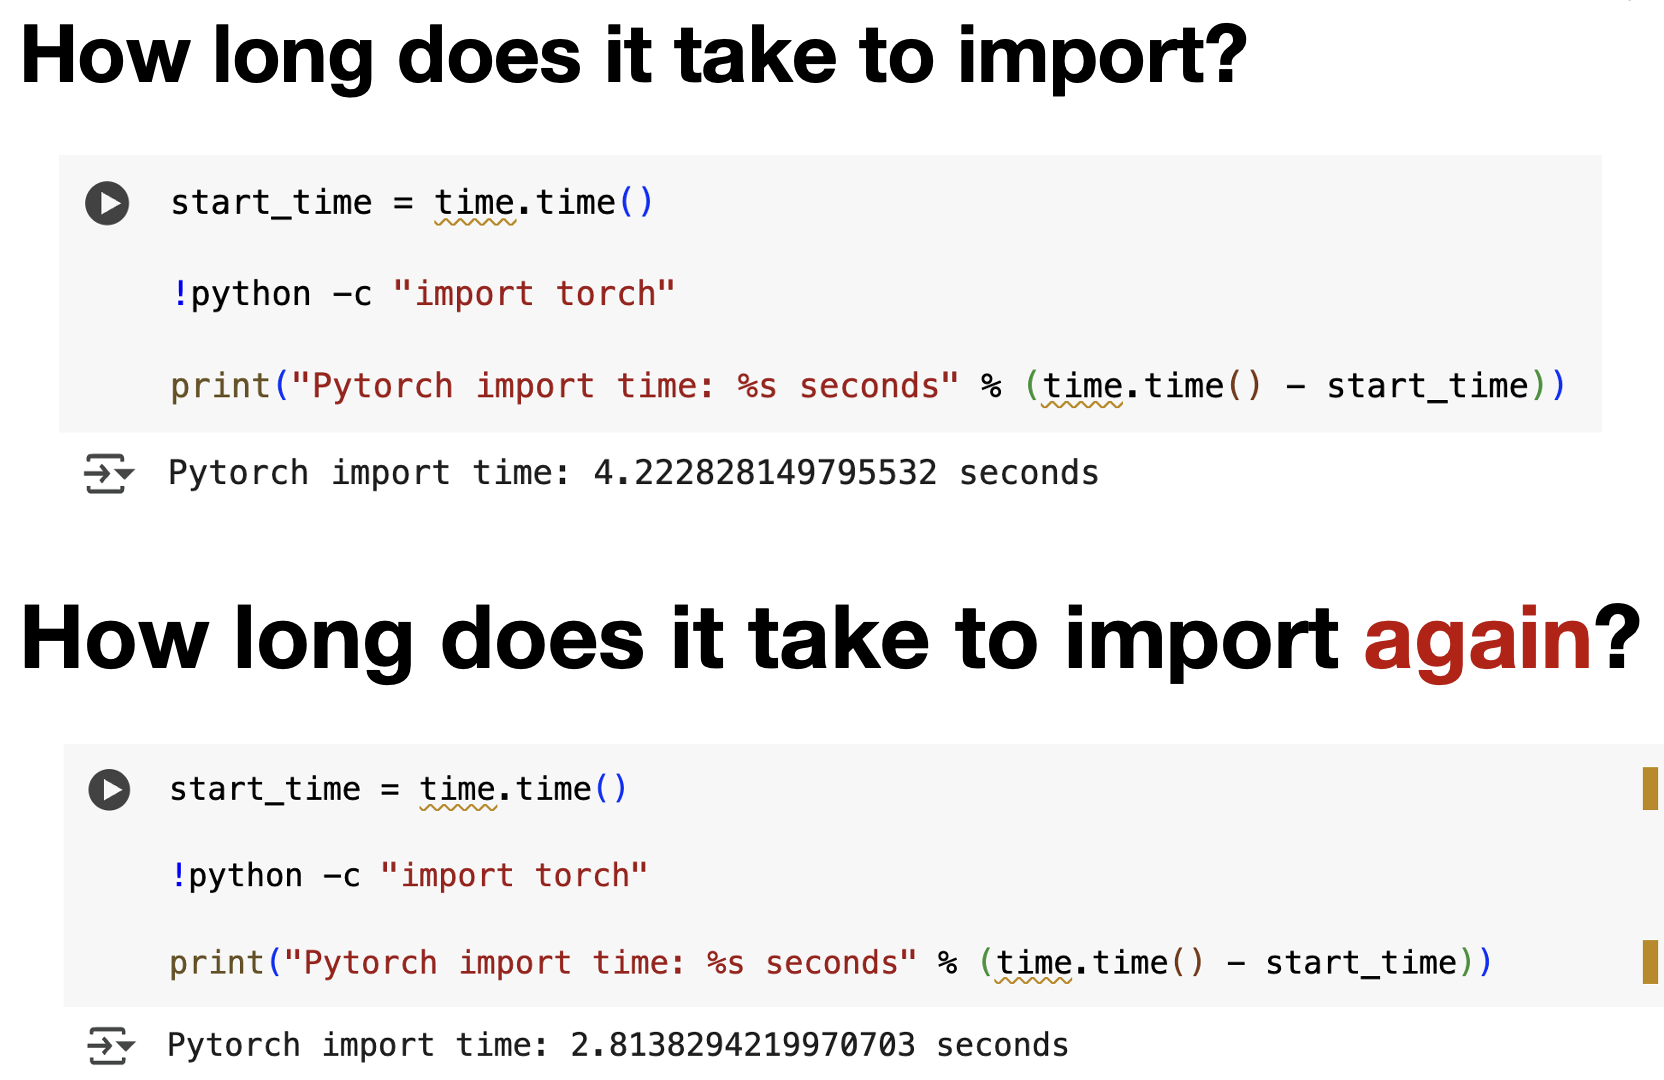
Send packet CA->Netherlands->CA 4.8 years Average time it takes to complete a bachelor's degreeIn the first two weeks, we discussed how dynamic libraries solve two related problems: disk space and loading time. When you use TensorFlow on Google Colab, the first time you import it, the system loads the massive library from disk into memory. This takes several seconds. But if you restart your notebook and import TensorFlow again, it loads much faster. Why? Because the OS has cached the library in memory.
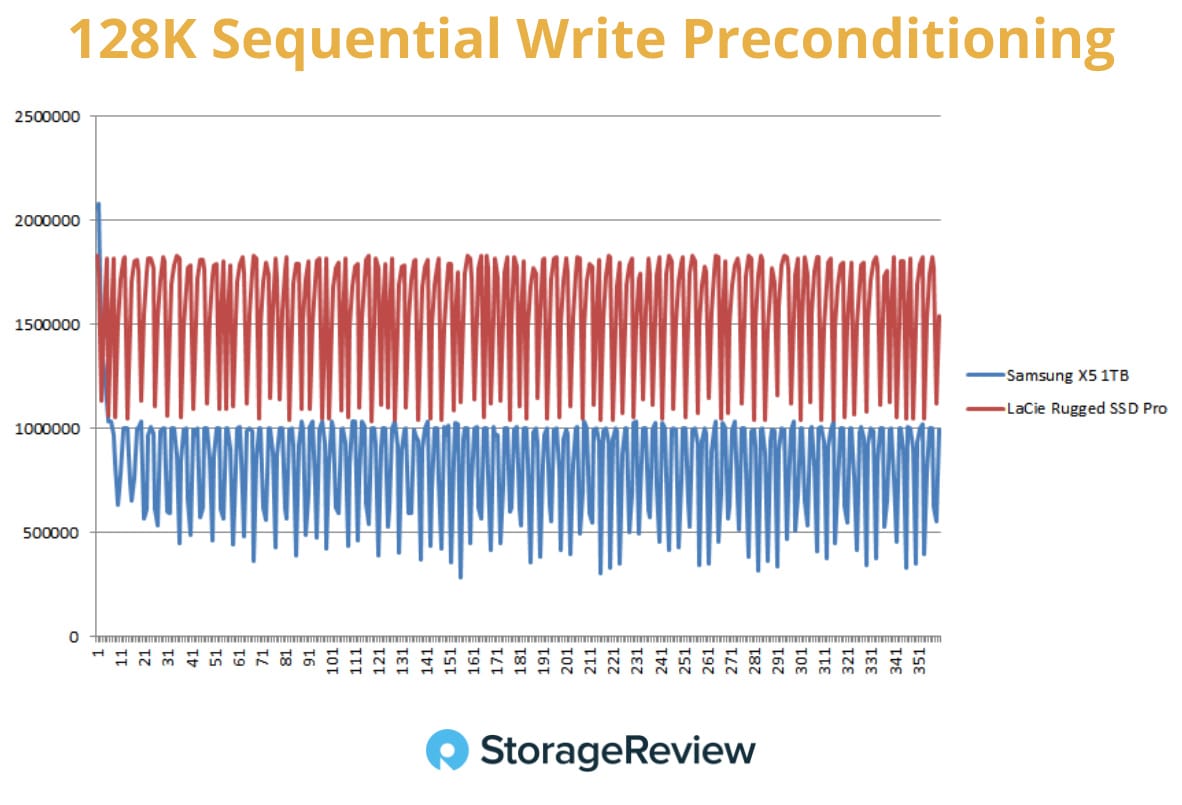
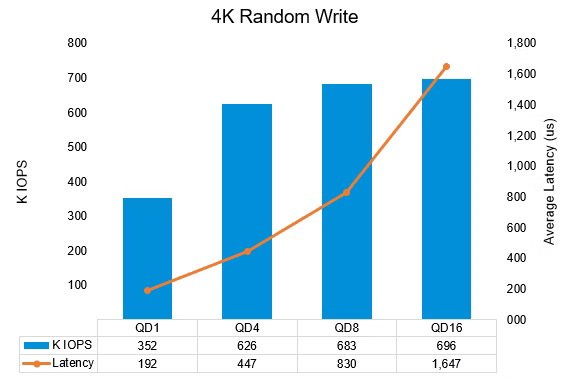
This week, we examine caching and buffering in detail. Before diving deeper, we need to understand the unit at which storage operates. Your hard disk or SSD doesn’t work with individual bytes. Instead, it organizes data into fixed-size units called pages or sectors. A page is typically 4 KB (4096 bytes). When the OS requests data from disk, it doesn’t ask for “give me 32 bytes at address X.” Instead, it says “give me the 4 KB page containing address X.” But CPU fetches data at an unit of cacheline (64 bytes). This is important because it means the size of disk I/O is much bigger than the granularity of CPU. When you call Suppose your program calls First, the kernel checks the buffer cache (or page cache). The buffer cache is coherent, meaning if two different processes read the same file, they both see the same cached data from this shared kernel buffer cache. If the data is already in the buffer cache from a previous read, the kernel is done: just return the data immediately without touching the disk. If the data is not in the buffer cache, the kernel issues a disk I/O request to fetch the relevant 4 KB page from the disk. Once the data arrives in the buffer cache, the kernel must then copy it from kernel memory into your application’s user-space memory. This second copy is required because of memory protection: your program cannot directly access kernel memory. Notice something inefficient here? The data was copied twice. Memory copy takes CPU time. Two copies also waste DRAM space. But there is also a benefit. If you call Similar for write, when you call The idea is that although caching/buffering needs to pay extra copy overhead, it avoids system call overheads, so it can be a win. However, this user-space buffer is not coherent. If two processes both read the same file, they each maintain their own separate user-space buffer. Process A’s buffer and Process B’s buffer contain independent copies of the data. This is why the kernel buffer cache is so important: it’s the single point of coherence for shared access. Sometimes you don’t want the kernel to cache your data. Imagine you’re writing a large video file to disk. The file is 50 GB, but your system has only 16 GB of RAM. If the kernel cache the data you write, it will evict other useful cached data from memory. This is called cache pollution. To prevent cache pollution, you can use direct I/O. With direct I/O, your application reads or writes data directly to disk without storing anything to kernel’s buffer cache. In Linux, you can open a file with the This command copies There’s a clever alternative to This avoids the double-copy. Only one copy exists in memory. Another bonus: if another process also memory-maps the same file, both processes are looking at the same cached pages in the kernel buffer cache. The buffer cache coherence automatically ensures both processes see the same data. Reading from cache is simple: if data is there, return it; if not, fetch it. For write buffering, the kernel must decide when to actually writes to disk. The kernel uses write buffering to batch small writes together. Suppose your program calls Once the writes reach the kernel, a similar batching occurs. The kernel collects many small writes that fall within the same 4 KB page into a single buffer. This is called write coalescing. Instead of writing the same page multiple times, the kernel combines all the writes into one page-sized operation and sends it to disk once. Write bandwidth on SSDs is maximum if we perform a lot of I/O operations at the same time instead of one by one. Try to run it and see the difference: But!!! If your computer’s power socket is unplugged after you write data but before the kernel flushes it to disk, that data is lost. If you don’t like that, you can call The kernel uses a policy called write-back caching by default. In write-back caching, when you call the On Linux data is marked as dirty to indicate it’s been modified but not yet written. Linux periodically flushes all dirty pages to disk in batches. Once the page that is cached or buffered in the memory is the same as the page on disk, the page is called clean In write-through caching, the kernel doesn’t return until the data has been physically written to disk. Write-through is safer but slower. Direct I/O is a form of write-through cache. Let’s verify that buffered write really return immediately and does not cause a context switch: The first For each command, observe the total time elapsed and the number of context switch. Storage devices have two different performance characteristics that often work against each other. Latency is the time it takes to satisfy a single read or write request. If you read a single 4 KB page from disk, how long does it take to get it? For a modern SSD, this might be around 100 microseconds. For a traditional hard disk, it could be 10 milliseconds. Latency determines how fast an operation feels. Throughput (also called bandwidth) is how many read or write operations a device can complete per second, or equivalently, how many bytes per second it can transfer. A device might have a throughput of 500 MB/second, meaning it can transfer 500 million bytes in one second. Here’s where it gets interesting. You might think that low latency and high throughput always go together, but they don’t. Consider shipping. An airplane has low latency: your package arrives in a few days. But an airplane has low throughput: only a few packages fly per day. A container ship, on the other hand, has high latency (your package takes months) but very high throughput (thousands of packages travel together). SSD works similarly: a single random read has relatively high latency, but when you queue up many reads simultaneously, the throughput can be enormous. This is measured by something called queue depth (QD). If your application sends one I/O request and then waits for it to complete before sending the next request, you have a queue depth of 1. But if your application sends 32 I/O requests simultaneously and lets them queue up inside the SSD controller, you have a queue depth of 32. At queue depth 32, the SSD can achieve much higher throughput, even though individual requests might experience higher latency (since they wait in queue). Here is a typical I/O benchmark (Micron Storage Benchmark: source): As you can see, when the QD (queue depth) increases, both throughput and latency increase. That is why write buffering is useful. The kernel collects sufficient among of dirty pages and flushes the cache at once into the SSD. By doing so, it can enjoy a good write bandwidth because the queue depth is high. When using direct I/O or memory-mapped I/O, your buffers must be 4 KB aligned. This means the starting address of your buffer must be a multiple of 4096. For example, address 0x1000 is aligned, but address 0x1001 is not. Observe: Why does alignment matter? Recall that disk pages are 4 KB and memory pages are 4 KB. When the kernel transfers data directly between memory and disk without intermediate copying, it must align memory pages with disk pages exactly. If your buffer started at an unaligned address, the kernel would have to perform internal copying to align the data, defeating the purpose of direct I/O. Modern SSDs have their own internal caching to increase write performance, known as SLC cache. When you write data to an SSD, it initially goes to the SLC cache. As long as the amount of data doesn’t exceed the SLC cache capacity, writes are very fast. But once the SLC cache fills up, the SSD must flush the cache to the slower internal storage. This will cause a terrible performance drop. In this benchmark, the write bandwidth of Samsung 980 PRO drops from 4000MB/s to 2000MB/s when its SLC cache is filled: You can see the SLC size of different SSDs here This benchmark tests the write performance of a portable SSD: The SLC cache of these SSDs seem to be very small or there is none. Notice that the write bandwidth jumps up and down. This is because when you keep writing and writing, the disk can become too hot. The disk controller will reduce performance to protect itself from burning out. When the temperature reduces, the disk controller can again raise the bandwidth. Caching has a huge influence on system performance, but it can also be deeply deceiving. When you buy a new SSD, you feel excited in the first few weeks. Write is so fast! But then, as you write more data into the SSD, you slowly discover the “reality” (國王的新衣). The performance drops … “The bitterness of poor quality remains long after the sweetness of low price is forgotten.” ― Benjamin Franklin This is why you must be skeptical when companies advertise performance numbers. Under what conditions did they benchmark? Was the drive empty or 80% full? Did they test with queue depth 1 or queue depth 32? Did they measure peak performance or sustained performance over 30 minutes? Were the caches warm or cold? Many vendors show you the best-case scenario (a quick burst write to an empty SSD with a warm cache) but real-world workloads don’t always look like that. When you benchmark your own programs, caching makes measurement tricky. Consider the For programs that perform a lot of disk I/O, the benchmarking results can be heavily influenced by disk caches and whether they are cold or warm. If you want consistent measurements, you need to control the cache state. You can use the This gives you the “best case” performance, which might be representative if your program runs repeatedly on the same data. But what if you want to measure the worst case performance, the cold-cache scenario? You need to explicitly clear the page cache before each benchmark run: This command tells the kernel to remove all pages from the buffer cache. Then, your next Caching makes systems fast, but it also makes them unpredictable. As a systems programmer, your job is to understand these layers deeply enough that you can predict and control performance, rather than being surprised by it. We human are incredibly slow compared to computers. When you type at your keyboard, you might produce a few characters per second, but in that same second, your computer can transfer millions of bytes and perform billions of calculations. This is why the OS doesn’t handle data one byte at a time. It would be absurd for the OS to perform one disk operation for each character you type. Instead, the OS works in units of 4 KB pages because that’s the natural disk I/O size. The OS automatically coalesces your tiny writes into page-sized operations. The OS also uses caching to hide the slowness of disk. It would be absurd if every time you wanted to eat 鮭魚, you had to fly to Norway. When you read a file the first time, yes, it’s slow … you’re going to Norway. But the OS keeps that data in the buffer cache. The second time you read the same file, you’re just opening your refrigerator. When you open VS Code and it loads in 2 seconds, you’re reading from cached pages in DRAM that were loaded during previous sessions. This is the magic trick of OS: it makes the disk appear far faster than it actually is.Pages and Blocks
fprintf(fp, "hello"), you’re asking to write 5 bytes. But the kernel doesn’t immediately perform a disk write operation for those 5 bytes. Instead, the kernel accumulates many small writes into a buffer, and when that buffer fills up to something close to a page boundary, it writes to disk. This buffering strategy dramatically reduces the number of disk I/O, which is very important because disk I/O is very slow.The Cache Hierarchy
fread() to read 100 bytes from a file. Here’s the journey that data takes:
fread() to 100 bytes, you only make a read() system call the first time. From the second time, you read more 100 bytes, these fread() can read directly from the user-spacee buffer without making a read() system call because in the first time, libc already load 4KB of data into the buffer. this is called prefetching.printf, the C library doesn’t immediately make a system call to the kernel. Instead, it copies your data into a temporary buffer in your application’s own memory. It is only when this buffer is full, or when you explicitly flush it, libc will make one write system call to pass the whole chunk of data to the kernel’s buffer cache.Direct I/O
O_DIRECT flag, or use the dd command with oflag=direct. For example:dd if=ubuntu.iso of=/dev/my-usb oflag=directubuntu.iso to an USB, but it tells the kernel “don’t cache this data; I won’t read it again, so polluting the cache with it is wasteful.” The kernel skips the buffer cache and writes directly from the application’s memory to the device.Memory Mapping
fread() called memory mapping: the mmap() system call. When you call mmap() on a file, you’re asking the OS to do place a region of the file directly into your application’s address space without copying. Instead of reading the file into a separate buffer and then copying to your heap, the kernel maps the buffer cache directly into your virtual address space. When you read from those memory location in the virtual address space, you directly read from the buffer cache.Write Caching & Write Coalescing
printf() five times to write five small data. Each printf() call writes to a user-space buffer maintained by libc. The libc library doesn’t immediately call write() system call for each printf(). It accumulates the writes. When the buffer fills up, or when the program explicitly calls fflush(), libc call write().#include <stdio.h>
#include <stdlib.h>
#include <string.h>
#include <time.h>
#include <unistd.h>
static double now(){ struct timespec t; clock_gettime(CLOCK_MONOTONIC, &t); return t.tv_sec + t.tv_nsec/1e9; }
int main(int argc, char **argv){
if (argc < 3){ fprintf(stderr, "Usage: %s write-through or write-coalescing\n", argv[0]); return 1; }
FILE *fp = fopen(argv[1], "w"); if (!fp){ perror("fopen"); return 1; }
char buf[4096]; memset(buf, 'X', sizeof(buf));
double t0 = now();
for (int i=0; i<5000; i++){
fwrite(buf, 1, sizeof(buf), fp);
if (!strcmp(argv[2], "write-through")) { fflush(fp); fsync(fileno(fp)); }
}
if (!strcmp(argv[2], "write-coalescing")) { fflush(fp); fsync(fileno(fp)); }
double t1 = now();
printf("mode=%s time=%.3f s\n", argv[2], t1 - t0);
return 0;
}gcc -O2 demo.c -o demo
./demo test.txt write-through
./demo test.txt write-coalescingfsync() to force the kernel to flush buffers to disk immediately.
Write-Back and Write-Through Caching
write() system call, the kernel returns control to your program immediately after placing the data in the buffer cache. The actual disk write happens later in the background. This makes writes appear fast to the application, but it introduces the durability risk we just discussed.dddd call write(fd, buf, 4000K) for one time, the second dd calls write(fd, buf, 4K) for 1000 times.yunchih@angel $ strace -c dd if=/dev/zero of=test bs=4000K count=1 2>&1 | head
1+0 records in
1+0 records out
4096000 bytes (4.1 MB, 3.9 MiB) copied, 0.0111685 s, 367 MB/s
% time seconds usecs/call calls errors syscall
------ ----------- ----------- --------- --------- ----------------
41.97 0.004807 1201 4 write
25.44 0.002914 728 4 read
12.97 0.001485 148 10 close
11.83 0.001355 75 18 11 openat
3.93 0.000450 450 1 execve
yunchih@angel $ strace -c dd if=/dev/zero of=test bs=4K count=1000 2>&1 | head
1000+0 records in
1000+0 records out
4096000 bytes (4.1 MB, 3.9 MiB) copied, 0.0414901 s, 98.7 MB/s
% time seconds usecs/call calls errors syscall
------ ----------- ----------- --------- --------- ----------------
63.27 0.006420 6 1003 write
33.56 0.003405 3 1003 read
2.88 0.000292 29 10 close
0.23 0.000023 1 18 11 openat
0.04 0.000004 0 10 mmapyunchih@angel $ sudo perf stat -e context-switches dd if=/dev/zero of=test bs=4000K count=1 oflag=direct
1+0 records in
1+0 records out
4096000 bytes (4.1 MB, 3.9 MiB) copied, 0.00543247 s, 754 MB/s
Performance counter stats for 'dd if=/dev/zero of=test bs=4000K count=1 oflag=direct':
1 context-switches
0.007534555 seconds time elapsed
0.000000000 seconds user
0.005731000 seconds sys
yunchih@angel $ sudo perf stat -e context-switches dd if=/dev/zero of=test bs=4K count=1000 oflag=direct
1000+0 records in
1000+0 records out
4096000 bytes (4.1 MB, 3.9 MiB) copied, 0.0216545 s, 189 MB/s
Performance counter stats for 'dd if=/dev/zero of=test bs=4K count=1000 oflag=direct':
1,000 context-switches
0.023533212 seconds time elapsed
0.000000000 seconds user
0.015128000 seconds sys
yunchih@angel $ sudo perf stat -e context-switches dd if=/dev/zero of=test bs=4000K count=1
1+0 records in
1+0 records out
4096000 bytes (4.1 MB, 3.9 MiB) copied, 0.00784169 s, 522 MB/s
Performance counter stats for 'dd if=/dev/zero of=test bs=4000K count=1':
3 context-switches
0.010150750 seconds time elapsed
0.000000000 seconds user
0.008459000 seconds sys
yunchih@angel $ sudo perf stat -e context-switches dd if=/dev/zero of=test bs=4K count=1000
1000+0 records in
1000+0 records out
4096000 bytes (4.1 MB, 3.9 MiB) copied, 0.00718135 s, 570 MB/s
Performance counter stats for 'dd if=/dev/zero of=test bs=4K count=1000':
4 context-switches
0.010053949 seconds time elapsed
0.004513000 seconds user
0.004513000 seconds sysLatency vs. Throughput

Page Alignment
posix_memalign guarantees 4 KB alignment; malloc does not.#include <stdio.h>
#include <stdint.h>
#include <stdlib.h>
#include <malloc.h>
int main(){
void *p1 = malloc(4096), *p2;
posix_memalign(&p2, 4096, 4096);
printf("malloc ptr = %p (%%4096=%zu)\n", p1, (size_t)((uintptr_t)p1 % 4096));
printf("aligned ptr = %p (%%4096=%zu)\n", p2, (size_t)((uintptr_t)p2 % 4096));
free(p1); free(p2);
return 0;
}Cache inside SSD
Cache is Deceptive
hyperfine tool, which is excellent for command-line benchmarking. Its documentation explicitly warns about cache effects:--warmup option to run your program a few times before measuring. This ensures the cache is warm:hyperfine --warmup 3 'grep -R TODO *'echo 3 | sudo tee /proc/sys/vm/drop_cachesread() will cache miss and must read from the disk.Conclusion