Process States in Linux
Niko is staring at an htop screen. The CPU utilization on a client’s server is spiking unpredictably.
“Le Mao! I don’t get it. The load is high, but I can’t find a single process that’s misbehaving.”
Nini walks over with a cup of tea. “You’re looking at the symptoms, but you don’t understand the language the system is speaking. It reminds me of a story from when I was a junior engineer at Redhat. Let me tell you about it. might help you.”
“It was 3 AM,” Nini began, “and I was on call. I got a call from the server room guard: “The server room sounds like a jet engine!” I rushed over to the building. One of our main PostgreSQL database servers was screaming. The cooling fans were at maximum speed, which usually means one thing: something is eating up all the CPU
“I ssh into the machine and ran htop. This is what I saw.”
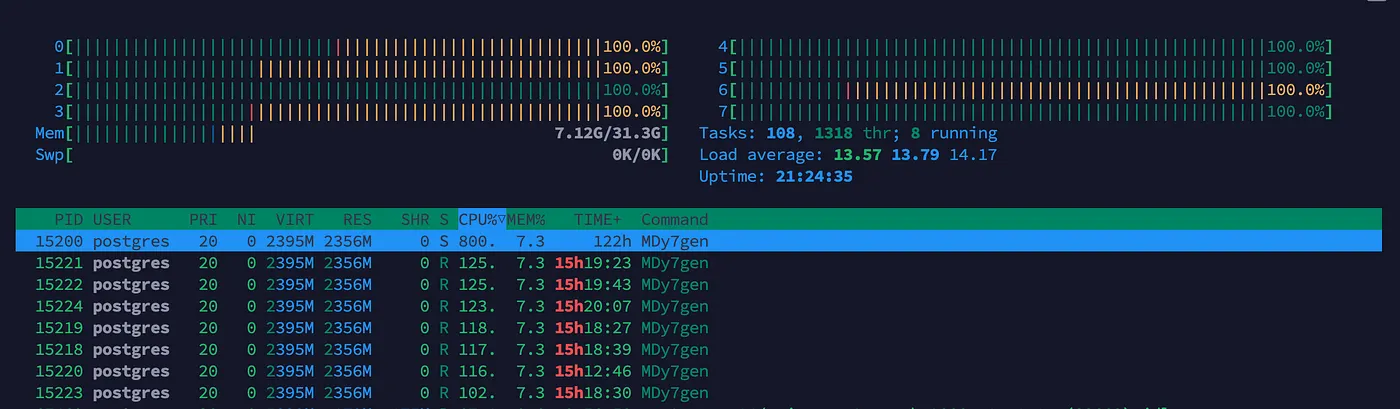
“My first thought was: Our database server has been hacked!”
Someone had installed cryptocurrency mining malware. But the question is, how could we tell this was malicious activity just by looking at the htop output?
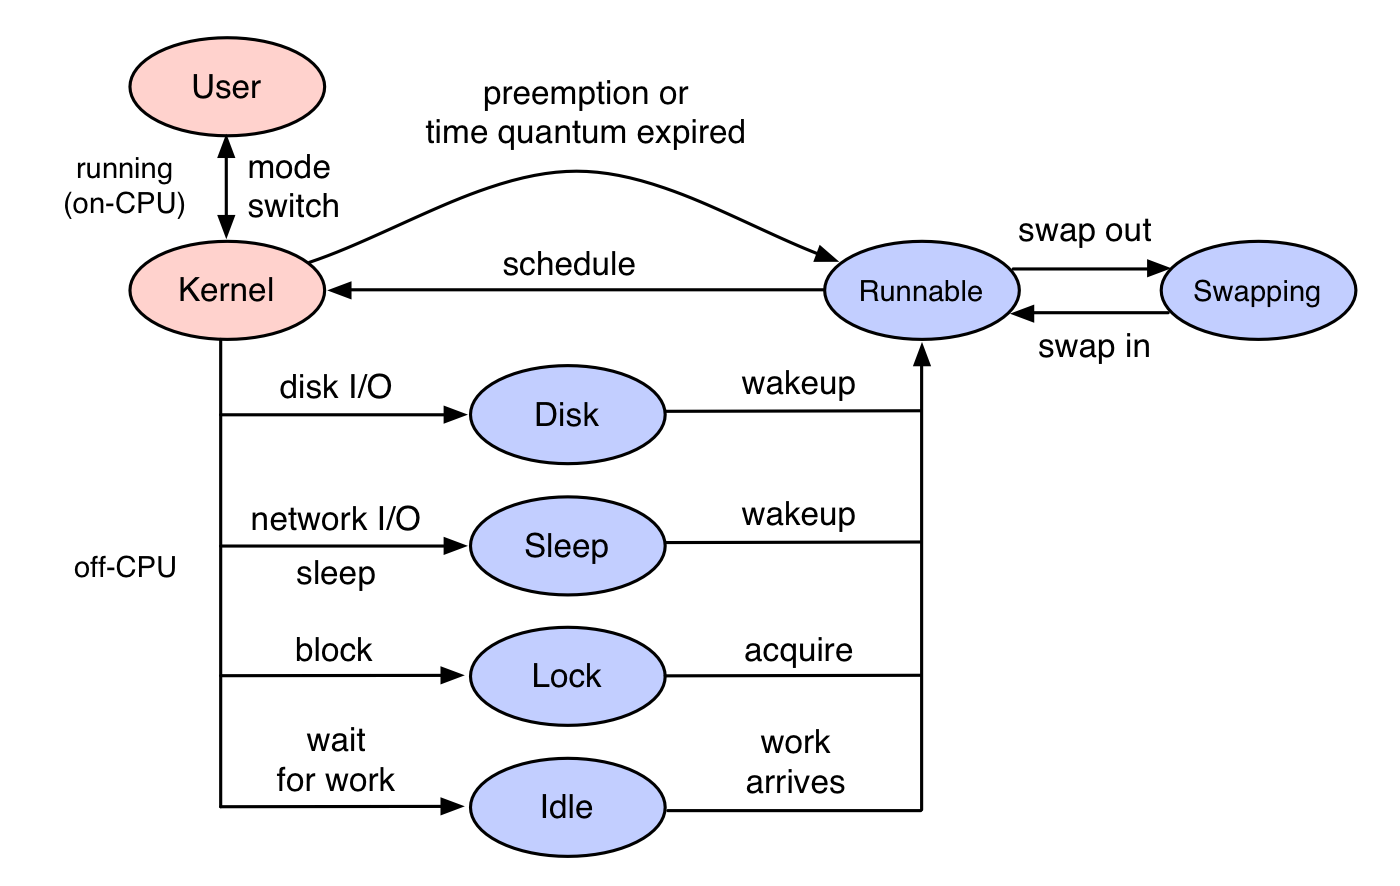
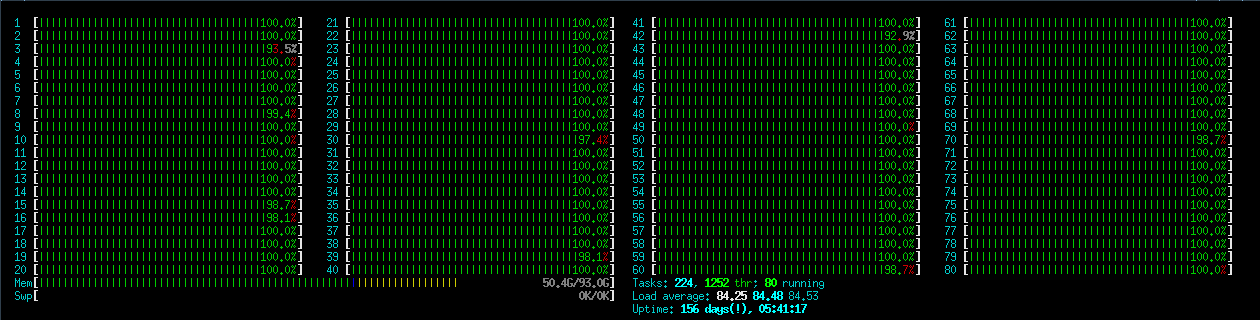
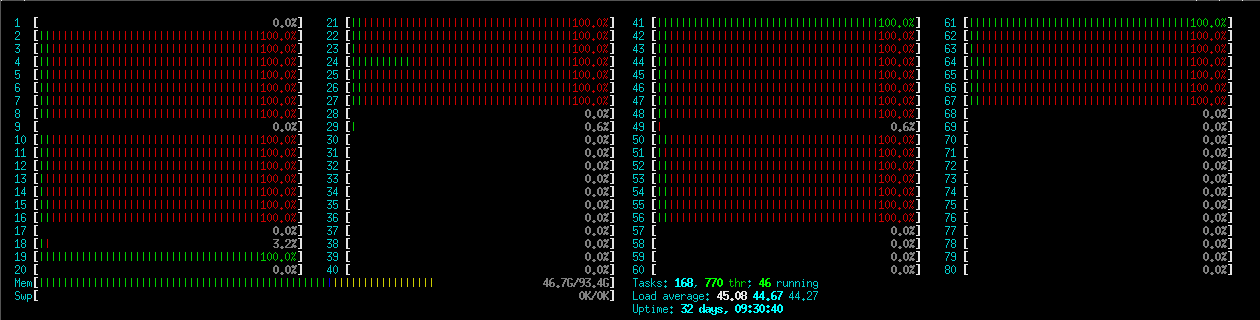
The answer lies in understanding Linux’s process states. To debug any system, you must first understand the fundamentals. This all comes down to the life cycle of a process. Step 1: Read the OSTEP Chapter Read Section 4.4 from the OSTEP textbook. After reading, you should be able to answer these questions: Step 2: Compare with Linux’s More Detailed States The three-state model is a good start, but in the real world with Linux, things are more specific. This diagram from performance expert Brendan Gregg is an excellent reference. Source: Brendan Gregg’s article on off-CPU analysis Linux gives us a more detailed view: Brendan Gregg defines Off-CPU Time as the total time a thread is not running on a CPU. This includes all the time spent waiting for I/O, locks, timers, and so on. TODO: Interruptable v.s Uninterruptable https://www.baeldung.com/linux/uninterruptible-process Step 3: Back to the Screaming Server Now, let’s apply this knowledge to the A normal database server has a completely different profile: The server wasn’t just busy; it was abnormally busy in a way that pointed directly to a CPU-bound, non-I/O process. That was the crypto-miner. The For example, load average of To get good at this, you need to see more patterns. Let’s analyze some According to the htop visual guide, the colors in the CPU bars mean: If a process is sleeping to wait for I/O, the CPU is not executing its code at all, so it does not contribute to CPU usage and appear as idle time. Look at this High-Performance Computing (HPC) workloads are often designed to max out the CPU. Here, all CPUs are filled with green bars. This is a pure calculation job, similar to the crypto-miner, but this one is legitimate science! Kernel time is minimal, because the job rarely interacts with the OS. Overall CPU utilization is much lower. Many tasks are in the S (sleep) state (wait for network I/O). Red bars show that a lot of time is in kernel processing shared memory copy or IPC. Load average is high, also because many processes are in uninterruptable sleep waiting for I/O. Nearly all 96 CPU cores are 100% utilized. Load Average is reported as Since the system has 96 cores, load average larger than 96 means that processes are competing for CPU time. To truly understand these states, create them yourself. Open a terminal and have Nini finishes her story. “So, by understanding the process states, I knew exactly what kind of problem I was dealing with. I found out the victim server, killed the bitcoin mining. It was a long night, but a good lesson.” Niko: “Boss, you explained better than Le Chat GPT! Is this CPU-bound or I/O bound? Which color will you most likely see for this process’s CPU bar? What is the state (single character) of the CHILD process? Please look at htop screenshot of the problematic server The system is dominated by the kernel’s What is most likely the process state these processes are in? (single character) How do you create a situation where the kernel itself is using 100% of every core? Can you show me an Process States
kill -9 a process in this state.htop screenshot from that night. The clues were all there:postgres), but the process name was suspicious (MDy7gen).CPU Load
uptime command shows us the load average on Linux. It is also shown in htop. It is displayed with three numbers: X Y Z. They represent the average length of CPU run queue that contains runnable or waiting processes over the last 1, 5, and 15 minutes. Specifically, it counts the number of processes in these states:3 2 1 means that on average, each core has three processes take turn being run. Load average can reflect the actual activity of the system better than CPU utilization. CPU utilization will be 100% both in system with load average of 3 and 6, but the latter has twice number of processes waiting to be run.Case Studies:
htop in the Wildhtop screenshots from other production systems.Case 1: Database Server
![]()
btop screenshot. The CPU oscillates between computation and waiting. Database is CPU-intensive in the query processing phase, but I/O-intensive in the data loading phase.Case 2: CPU-bound HPC Job
Case 3: I/O-bound HPC Job
Case 4: Parallel Processing with Data Download

157.55 143.11 124.84.Create Your Own Workloads!
htop running in another terminal. Run each command and watch what happens to the CPU bars.# 1. CPU-intensive task (Watch for solid green bars)
# This reads from a source of infinite zeros and throws it away. Pure CPU work.
dd if=/dev/zero of=/dev/null# 2. I/O-intensive task (CPU usage will be low, process in 'S' or 'D' state)
# This searches your entire filesystem. Most of the time is spent waiting for the disk.
find / -name "*.txt" 2>/dev/null# 3. Mixed workload
# This reads files from the disk (I/O) and compresses them (CPU).
tar -czf large_archive.tar.gz /usr/share/Questions
Q1
#include <unistd.h>
#include <stdio.h>
#include <stdlib.h>
#include <time.h>
int main() {
    srand(time(NULL));
    int i, count = 0, n = 1e9;
    double x, y, z, pi;
    for(i = 0; i < n; ++i) {
        x = (double)rand() / RAND_MAX;
        y = (double)rand() / RAND_MAX;
        z = x * x + y * y;
        if( z <= 1 ) count++;
    }

    pi = (double) count / n * 4;
    printf("Approximate PI = %g", pi);
}Q2
#include <unistd.h>
#include <stdlib.h>
#include <stdio.h>

int main(void)
{
    pid_t pid = fork();
    if (pid == 0) { /* Child */
        printf("Child PID: %d\n", getpid());
        _exit(0);
    }

    printf("Parent PID: %d\n", getpid());
    sleep(60);
    return 0;
}
gcc -o sleep sleep.c
./sleep &
ps -o pid,ppid,state,cmd | grep sleepQ3
kswapd0 to squeeze out free memory. There might be a lot of page faults going on. (電腦記憶體被用爆,kernel 哀嚎 …)Q4 (Bonus)
htop screenshot where every CPU bar is solid red. This means the kernel is doing all the work, and your user-space programs are mostly waiting?